Why Growth Charts May Show Different Percentiles
A percentile is a comparison with a particular growth reference, not a permanent label attached to a height value. If two printouts show different positions, first check the measurement type, age input and chart identity. The difference may involve the comparison method as well as the child’s measurements.
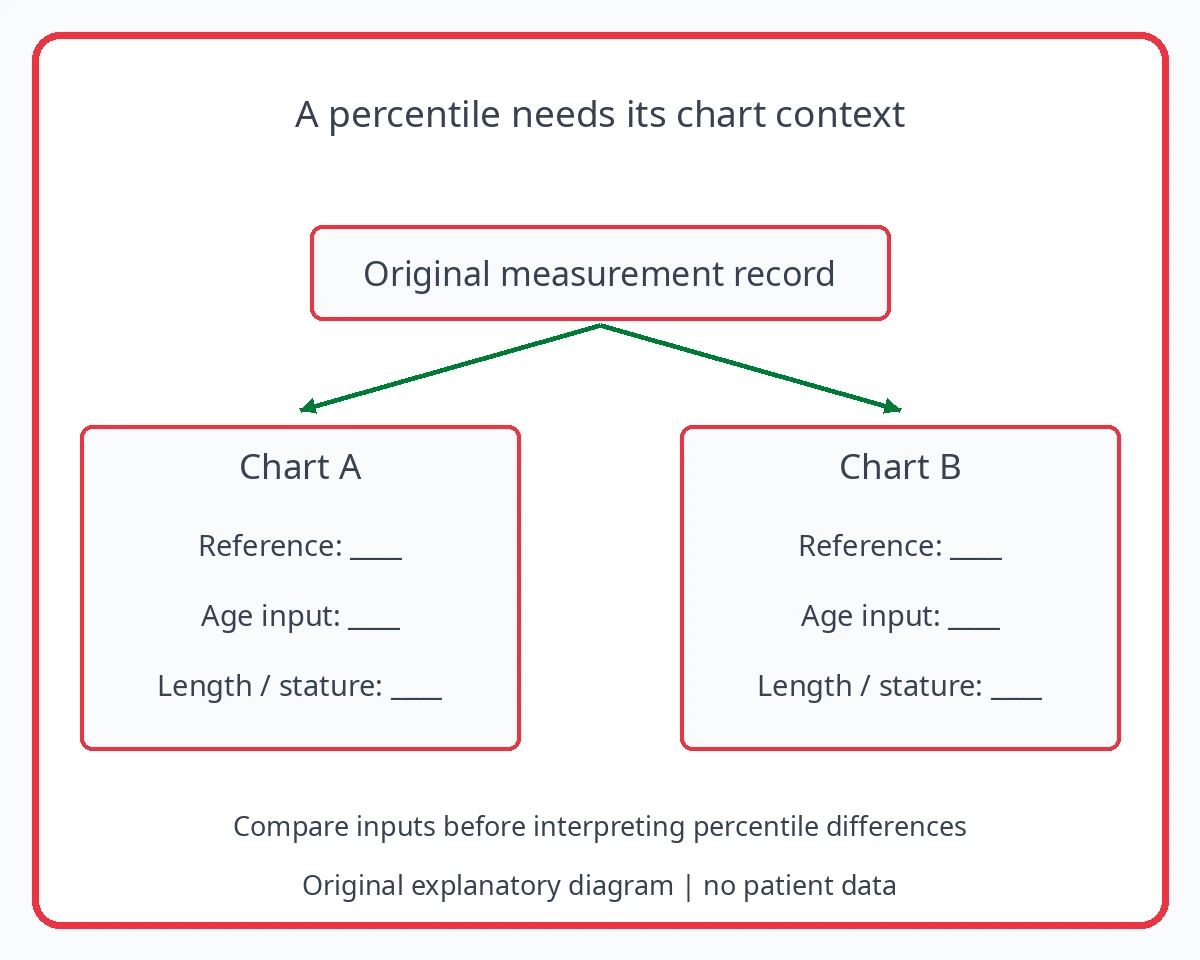
Keep the reference attached to the result
CDC distinguishes WHO growth standards and CDC growth references, including their use at different ages in the United States. Those examples show why a chart’s name and intended group matter. They do not prescribe one chart for every Italian or other international service. Ask the clinician which reference applies in the child’s care.
Save the chart name, version where available, sex-specific reference, measurement type and age basis with the original value and date. A cropped screenshot showing only a percentile can lose the information needed to interpret it. Do not assume two tools use the same reference because their curves look alike or because both allow an entry in centimetres. [1] [2]
For another reference-dependent growth measure used in studies, read Height Standard Deviation Scores in Research: A Reader's Guide
Length and standing height are different inputs
CDC’s guidance describes the transition from recumbent length to standing stature as one of the changes that can accompany moving between charts. The plotted position can therefore change when measurement type or reference changes. A lying-length entry should not be relabelled as standing height simply because the units match.
Compare the records field by field before comparing the displayed percentile. Use the actual measurement date and the age information supplied to the tool. If one tool’s age basis is unknown, leave that part unresolved. Averaging the two displayed percentiles does not recover a missing reference or make different measurement methods equivalent. [2]
Two printouts with an unresolved comparison
This fictional example explains how to keep a measurement record understandable. It is not a child’s clinical record or a recommended monitoring schedule.
| Part of the record | What is known | Why the distinction matters |
|---|---|---|
| Measurement type | Printout A says recumbent length; B says standing height | These are not interchangeable input labels |
| Original record | Both need their source value, unit and measurement date | A display alone cannot verify the input |
| Reference | A identifies its chart; B has a cropped chart heading | B’s reference still needs confirmation |
| Age basis | Date of birth and measurement date need checking | Do not assume the tools used the same age |
| Displayed difference | Percentiles differ; no values invented here | Clarify the inputs before a clinical conclusion |
Averaging two percentiles does not resolve the mismatch
In the fictional example, one printout uses length and the other standing height, while the second chart’s heading is missing. The first task is to recover the original measurement and chart information. Calculating a midpoint between the percentiles would only create a third number whose meaning is unclear.
Bring both complete records to the team and ask which entries are appropriate to compare. If an input was copied incorrectly, keep the original and the correction identifiable. A change in the plotted position alone does not establish a hormone disorder or a need for treatment.
For the additional age questions after premature birth, see Growth Charts After Premature Birth: Questions for Your Child's Clinician
Let the clinical question guide the comparison
Once the records are identifiable, the clinician can consider the pattern with the child’s history and the measurement methods. Keep uncertainty in the record if a source cannot be recovered. Do not fill a missing chart name with the one you usually use or infer an exact percentile from the visual position of an unclear image.
If prematurity or another factor affects the age convention, ask the service how that should be handled for its chosen chart. The important step is to use a consistent, documented approach appropriate to the assessment. This article explains why records can differ; it does not interpret an individual child’s percentile.
Chart examples are not a universal chart prescription
The US chart examples do not prescribe which chart every Italian or other international service must use. This article does not interpret an individual child’s percentile or diagnose abnormal growth.
Sources and reading context
- CDC growth charts — Chart provenance; US charts not universal choice
- CDC using WHO growth charts — US chart recommendations, length versus stature and reference transitions; not a universal chart prescription