Growth Charts After Premature Birth: Questions for Your Child's Clinician
After premature birth, a growth-chart comparison can go wrong before any percentile is read: the age input may not mean what the reader thinks it means. Keep the original birth information, the measurement date and the chart’s age convention together. In particular, do not apply a second correction to an age that has already been adjusted.
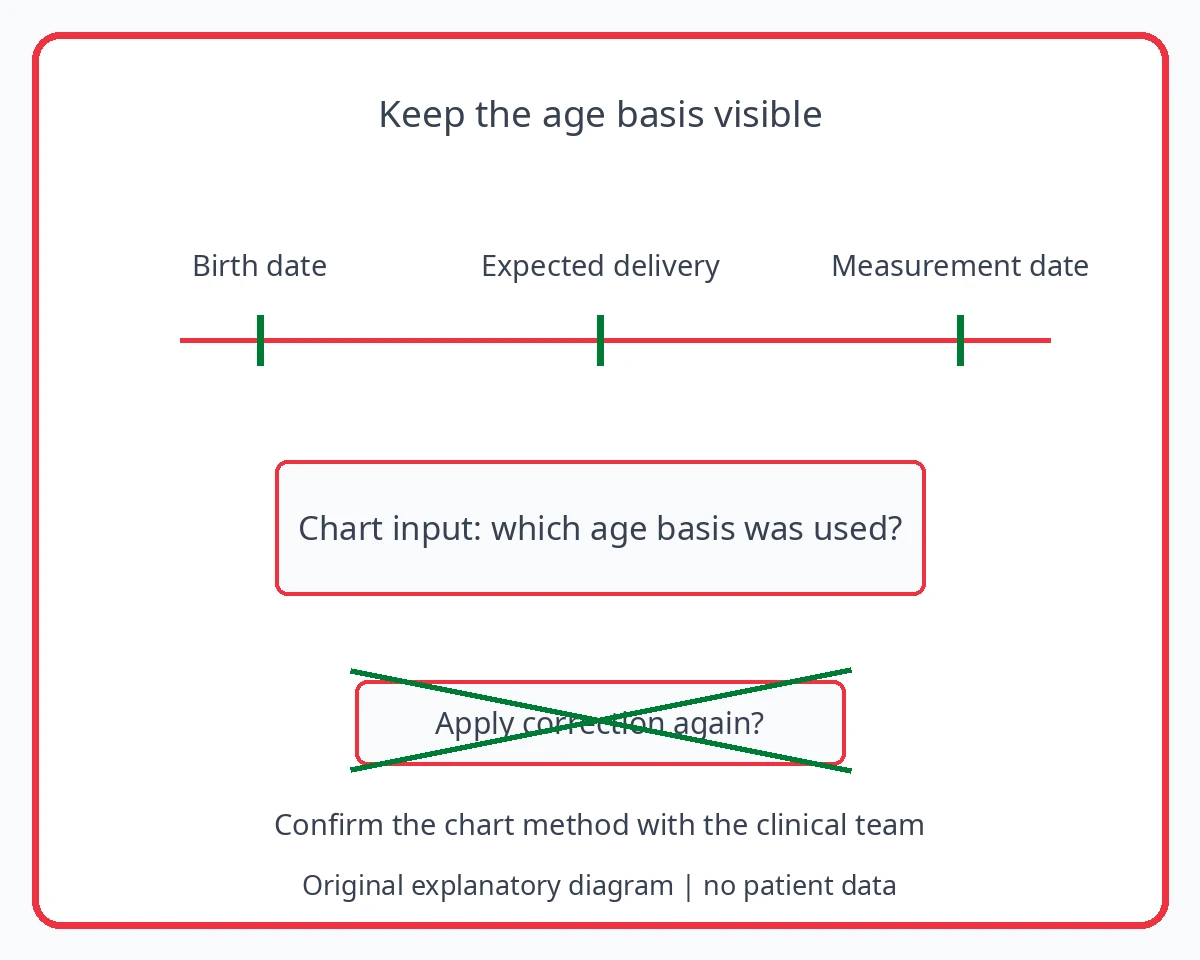
Start with dates, then identify the age convention
Chronological age is elapsed time since birth. Corrected-age approaches account for early birth in the setting of the chosen chart and clinical guidance. RCPCH’s UK-WHO neonatal and infant close-monitoring charts are a specialized resource for very preterm infants and infants with significant early health problems. Their defined scope is not a rule that every app or every service uses in the same way.
Retain the recorded birth date, expected delivery date and gestational information where available. Keep the measurement date separate. These details help the team explain the age used for a particular plot. If a record gives only an age without saying whether it is chronological or corrected, ask rather than choosing the interpretation that makes the percentile seem more plausible. [1]
Check what the chart or app actually expects
An input called “age” may need clarification. Does the tool ask for original dates and apply an adjustment itself, or does it expect an age already calculated by the clinical team? Do not assume the answer from the appearance of the graph. Preserve the service’s explanation alongside the result, especially when transferring an entry from a printout into another system.
Chart identity matters too. RCPCH provides a specific close-monitoring resource, while CDC describes WHO-chart use and the later change from length to standing stature in its US guidance. These sources illustrate why age convention, reference and measurement type belong with the number. They do not establish which chart an individual child in Italy should use. [1] [2] If the report also uses an SDS, read that height score with its reference before comparing it with a score from another source.
How an already corrected age can be adjusted twice
This fictional example is an original recording aid, not a clinical chart, a treatment plan or a real family’s record.
| Information | What the example contains | What still needs care |
|---|---|---|
| Original records | Birth details and measurement date are retained | These are the foundations for checking the plot |
| Clinic printout | Explicitly labelled as using corrected age | The correction has already been applied there |
| Second tool | Fictional app applies a prematurity adjustment itself | Confirm what input it expects |
| Mistaken transfer | Parent enters the clinic’s already corrected age | A second adjustment changes the intended age basis |
| Resolution | Keep the original and ask the team to explain the input | Do not compare the resulting percentiles as equivalent |
Keep a transfer error separate from a growth change
In the fictional example, the clinic printout and the second tool are not using the intended input in the same way. A changed plotted position cannot be read as a change in the child’s growth until that mismatch is resolved. Choosing whichever percentile looks more reassuring would leave the underlying input error in place.
Bring the original dates and the complete printout to the team. Ask it to identify the correct input convention and document any correction. Keep the earlier record identifiable so that a revised display is not mistaken for a newly measured height or length.
For chart-reference and measurement-type differences, read Why Growth Charts May Show Different Percentiles
Record the plan for a future chart transition
Ask which chart the service is using now, which age convention it has applied and how a later transition will be handled. The answer may involve both the chart reference and the measurement method. Write down the explanation with the result rather than relying on a memory of which line or app screen was used.
If original birth information cannot be recovered, say what is missing. This article supplies no self-directed age-correction calculation or universal stopping age for correction. The team needs to select and interpret the chart in the child’s context; the parent’s record helps make that interpretation traceable.
For keeping growth records from different sources traceable, see Combining School and Clinic Height Records Without Losing Context
The clinical team selects the chart and age convention
No self-directed corrected-age calculation, age cutoff or treatment decision is provided. The child’s team should select and interpret the appropriate chart in context.
Sources and reading context
- RCPCH neonatal and infant close monitoring growth charts — Named UK-WHO NICM reference and corrected age; not universal chart or a self-diagnosis tool
- CDC using WHO growth charts — US chart recommendations, length versus stature and reference transitions; not a universal chart prescription